
When we are talking about hypothesis testing, what we are merely trying to do is reframing a qualitative question into a mathematical problem. For example, we might ask:
Do discounts have a statistically significant effect on the number of products customers order? If so, at what level(s) of discount?
And reframe it to:
, the mean of the amount sold in orders with discounts is less or equal to the mean of the amount sold in orders without discounts.
Our goal usually is to reject our formulated null hypothesis by calculating the p-value which we generally want to be p < 0.05 (i.e., there’s only a 5% chance that two identical distributions could have produced these results).
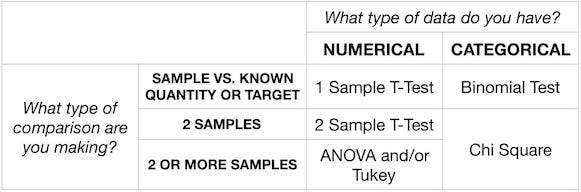
What type of data do we have? Categorical or Numerical?
We first want to find out what type of data we are dealing with whether it is continuous or categorical. For example, we want to find the mean height of all boys in a school year, and we could be very very accurate and measure every boy to the n-th digit after the comma. In this case, we are dealing with continuous (numerical) data. On the other hand, we have categorical data if we want to know if the girls have a significant different preference in what type of fruit (apple, bananas, plums etc) they eat.
How many samples am I comparing?
- 1 Sample i.e., comparing an actual result against a desired target
- 2 Sample i.e., comparing a control and treatment group or an A/B test
- More than 2 Sample i.e., comparing three different variants of a landing page
1 Sample T-Test
Compares a sample mean to a hypothetical population mean. It answers the question “What is the probability that the sample came from a distribution with the desired mean?” Use this when you are comparing against a known target (like a statistic from a paper or a target metric).
ttest_1samp requires two inputs, a distribution of values and an expected mean:
    tstat, pval = ttest_1samp(example_distribution, expected_mean)
    print(pval)
2 Sample T-Test
A 2 Sample T-Test compares two sets of data, which are both approximately normally distributed.The null hypothesis, in this case, is that the two distributions have the same mean. Use this when you are comparing two different numerical samples.
ttest_ind requires two distributions of values:
    tstat, pval = ttest_ind(example_distribution1, example_distribution2)
    print(pval)
ANOVA
ANOVA compares 2 or more numerical datasets without increasing the probability of a false positive. In order to use ANOVA, The samples are independent. Each sample is from a normally distributed population.The population standard deviations of the groups are all equal. This property is known as homoscedasticity.
f_oneway (scipy.stats) requires two or more groups:
    fstat, pval = f_oneway(data_group1, data_group2, data_group3, data_groupN)
    print(pval)
ols (statsmodels)
    model_name = ols('outcome_variable ~ group1 + group2 + groupN',
                     data=your_data).fit()
    model_name.summary()
Tukey
Tukey’s Range Test compares more than 2 numerical datasets without increasing the probability of a false positive. Unlike ANOVA, Tukey tells us which datasets are significantly different. Many statisticians use Tukey instead of Anova. Note: pairwise_tukeyhsd is from StatsModels, not SciPy!
pairwise_tukeyhsd# requires three arguments:
- A vector of all data (concatenated using np.concatenate)
- A vector of labels for the data
- A level of significance (usually 0.05)
    v = np.concatenate([a, b, c])
    labels = ['a'] * len(a) + ['b'] * len(b) + ['c'] * len(c)
    tukey_results = pairwise_tukeyhsd(v, labels, 0.05)
Binomial Test
Compares an observed proportion to a theoretical ideal. Examples:
- Comparing the actual percent of emails that were opened to the quarterly goals
- Comparing the actual percentage of respondents who gave a certain survey response to the expected survey response
binom_test requires three arguments:
- The number of successes (the numerator of your proportion)
- n - the number of trials (the denominator of your proportion)
- p - the proportion you are comparing to
    pval = binomtest(numerator, n=denominator, p=proportion)
    print(pval)
Chi Squared Test
If we have two or more categorical datasets that we want to compare, we should use a Chi Square test. It is useful in situations like:
- An A/B test where half of users were shown a green submit button and the other half were shown a purple submit button. Was one group more likely to click the submit button?
- Men and women were both given a survey asking “Which of the following three products is your favorite?” Did the men and women have significantly different preferences?
chi2_contingency requires a contingency table of all results:
    chi2, pval, dof, expected = chi2_contenigency([cat1yes, cat1no],
                                                  [cat2yes, cat2no])
    print(pval)
Use Case
If we are going back to our example for a null hypothesis from above we can use either the 2 Sample T-Test (ttest_ind) or ANOVA. All approaches depend on how we are going to prepare the data.
Let take a practical example and work through it on the Northwind database Microsoft provides.
1. Join ‘OrderDetail’, ‘Product’ and ‘Category’ and assign meaningful names to the features:
    SELECT OrderDetail.Id orderdetail_id,
           OrderDetail.ProductId orderdetail_prodid,
           OrderDetail.Quantity orderdetail_quantity,
           OrderDetail.UnitPrice orderdetail_unitprice,
           OrderDetail.Discount orderdetail_discount,
           Product.Id product_id,
           Category.Id category_id,
           Category.CategoryName category_name
    FROM Category
    JOIN Product ON Category.Id = Product.CategoryId
    JOIN OrderDetail ON Product.Id = OrderDetail.ProductId;
data = pd.read_sql_query(your_sql_command, engine)
$\tiny \ast \text{ The SQL statement should be inside of ```}$
2. Extract all ‘Unit price’ and split them into two lists for simplicity:
    d_df = Q2_df['orderdetail_unitprice'].where(Q2_df['discount_bool'] == 1)
    nd_df = Q2_df['orderdetail_unitprice'].where(Q2_df['discount_bool'] == 0)
    discount = d_df.tolist()
    no_discount = nd_df.tolist()
3. Run the 2 Sample T-Test (Note: the ttest_ind creates a readable statement:
    stats.ttest_ind(discount, no_discount, equal_var = False)
    # Ttest_indResult(statistic=-2.9756718793666415, pvalue=0.0034331287209264576)
4. As a final step we want to calculate the effect size using Cohen’s $d$. Cohen’s $d$ is typically used to represent the magnitude of differences between two (or more) groups on a given variable, with larger values representing a greater differentiation between the two groups on that variable.
    cohens_d = (mean(x) - mean(y)) / (sqrt((stdev(x)**2 + stdev(y)**2) / 2))
    print("Cohen's D: {}".format(cohens_d))
    # Cohen's D:  0.4564472299543739
5. Conclusion, because our p-value (0.0034) is not significant, we reject the null hypothesis in support of the alternative.
Further Reading
Hypothesis Testing is a big topic, and this was just a quick overview of how someone can approach a question using Python. Here is a short list of resources that I fund helpful:
- Z-statistics vs. T-statistics - Khan Academy
- A/B Testing: The Definitive Guide to Improving Your Product - Dataquest
- Understanding t-Tests - The Minitab Blog
- A Gentle Introduction to Effect Size Measures in Python - Machine Learning Mastery
- Robust effect sizes for 2 independent groups - basic statistics