
For my first Data Science project at Flatiron, we got the King County Housing dataset from Kaggle to work with.
I first wanted to know where King County is. Is the county in a rural area, suburban area or just a big city like New York or a combination of some or all of them. To get a basic understanding and feel for what is the data represents. After going through the scrubbing part and dealing with the not so clean data handed, and having a better understanding of what is in the dataset, which leads me to the following questions:
- Is location of a house by zip code (neighbourhood) an indicator for the house price?
- Do zip codes (neighbourhoods) with the higher housing density have an effect on selling price?
Also, what visualisation technique should or can I use to present it best? My choice was to use a map to visualise the data. For that, I picked the folium package.
The dataset has (not all) the zip codes for King County. To visualise the zip codes, we need the geojson data. Which we luckily can find on the King County website.
First, we want to get all zip codes in the dataset into a separate dataset.
# Set zipcode type to string (folium)
dataset['zipcode'] = dataset['zipcode'].astype('str')
# get the mean value across all data points
zipcode_data = dataset.groupby('zipcode').aggregate(np.mean)
zipcode_data.reset_index(inplace = True)
For this example, we want to display the housing density. So we need to sum all zip codes up and add it to our zipcode_data.
# count number of houses grouped by zipcode
dataset['count'] = 1
temp = dataset.groupby('zipcode').sum()
temp.reset_index(inplace = True)
temp = temp[['zipcode', 'count']]
zipcode_data = pd.merge(zipcode_data, temp, on='zipcode')
# drop count from org dataset
dataset.drop(['count'], axis = 1, inplace = True)
Before we move on to display “all” zip codes in our dataset, we want to make sure that the geodata has only the zip codes found in our dataset. (Note, this code is not my brainchild).
# Get geo data file path
geo_data_file = os.path.join('data', 'king_county_wa_zipcode_area.geojson')
# load GeoJSON
with open(geo_data_file, 'r') as jsonFile:
geo_data = json.load(jsonFile)
tmp = geo_data
# remove ZIP codes not in geo data
geozips = []
for i in range(len(tmp['features'])):
if tmp['features'][i]['properties']['ZIPCODE'] in list(zipcode_data['zipcode'].unique()):
geozips.append(tmp['features'][i])
# creating new JSON object
new_json = dict.fromkeys(['type','features'])
new_json['type'] = 'FeatureCollection'
new_json['features'] = geozips
# save uodated JSON object
open("cleaned_geodata.json", "w").write(json.dumps(new_json, sort_keys=True, indent=4, separators=(',', ': ')))
Finally, we have our function to display our map and housing density. I wrote it as a function I that I could easily visualise other features like house prices.
def map_feature_by_zipcode(zipcode_data, col):
""" Generates a folium map of Seattle
:param zipcode_data: zipcode dataset
:param col: feature to display
:return: m
"""
# read updated geo data
king_geo = "cleaned_geodata.json"
# Initialize Folium Map with Seattle latitude and longitude
m = folium.Map(location=[47.35, -121.9], zoom_start=9,
detect_retina=True, control_scale=False)
# Create choropleth map
m.choropleth(
geo_data=king_geo,
name='choropleth',
data=zipcode_data,
# col: feature of interest
columns=['zipcode', col],
key_on='feature.properties.ZIPCODE',
fill_color='OrRd',
fill_opacity=0.9,
line_opacity=0.2,
legend_name='house ' + col
)
folium.LayerControl().add_to(m)
# Save map based on feature of interest
m.save(col + '.html')
return m
…and our function call.
f.map_feature_by_zipcode(zipcode_data, 'count')
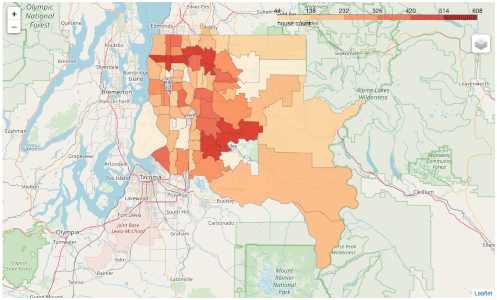
The main strength I can see in our case is that we can answer our question regarding housing density by zip code.
The weakness here, unfortunately, lies in our given dataset itself. Because we only have a subset of about 22k houses represented. Another weakness I can see is. House prices are not so much related to zip codes, instead to neighbourhoods. If we go and look at Zillow, we can search by neighbourhood. Moreover, Zillow offers a geojson file for that.
However, I guess I get myself over my head here.